Introduction
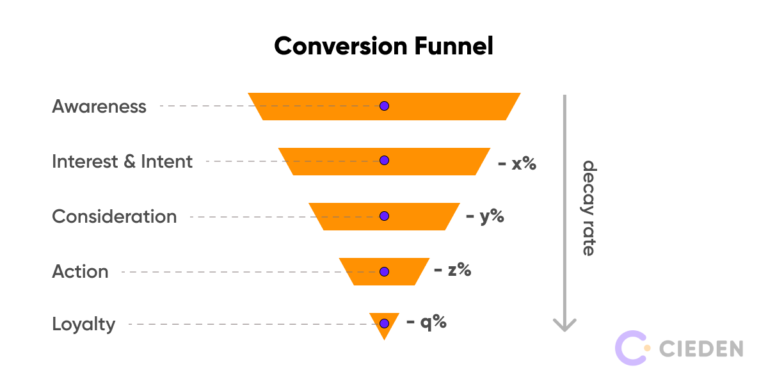
Funnel analysis is a practical way to understand how users move through a product journey, from the first interaction to a final conversion. A “conversion” might mean a purchase, a sign-up, a demo request, or even completing a key in-app action. The funnel view helps you identify where users drop off, how large each drop-off is, and which steps create the biggest friction. For anyone learning growth analytics—whether through a data analyst course in Pune or on-the-job experience—funnel analysis is one of the most useful frameworks because it turns user behaviour into clear, measurable stages.
A good funnel analysis does more than report numbers. It explains why users leave, which segments are affected, and what changes can improve completion rates. When done correctly, it becomes a decision-making tool for product, marketing, and sales teams.
What Funnel Analysis Measures and Why It Matters
A funnel is a sequence of steps that represent the intended user pathway. For an e-commerce site, the steps might be: landing page → product view → add to cart → checkout → payment success. For a SaaS product, it could be: visit → sign-up → onboarding → activate feature → upgrade plan.
Funnel analysis matters because overall conversion rates often hide important details. If a product has a 3% conversion rate, you still need to know where the 97% are leaving. The biggest benefit is prioritisation: it highlights the exact step where improvements will generate the highest return.
In many organisations, teams track dozens of metrics. Funnel analysis keeps focus on a single question: “Where do users stop progressing, and what can we do about it?” This focus is also why funnel analysis is frequently included in a data analytics course curriculum—because it reflects real business problem-solving.
Step-by-Step Funnel Analysis Methodology
1) Define the Funnel Stages Clearly
Start by defining stages that match real user actions. Each stage should be:
- Measurable (based on event data, not assumptions)
- Sequential (users typically experience steps in order)
- Meaningful (each step represents a real commitment or intent shift)
Avoid vague steps like “user becomes interested.” Instead, use trackable actions such as “clicked pricing,” “submitted form,” or “completed checkout.”
2) Ensure Proper Event Tracking and Data Quality
Funnel analysis is only as good as the tracking behind it. Common tracking issues include:
- Events not firing consistently (browser differences, ad blockers, mobile vs desktop bugs)
- Duplicated events (inflated counts)
- Incorrect timestamps or missing user identifiers
- Unclear definitions (e.g., “sign-up” tracked at form submit vs email verification)
Before analysing drop-offs, validate the instrumentation. Compare event counts across sources (analytics tool vs backend logs) and check whether user sessions and IDs are stitched correctly.
3) Choose the Right Funnel Type
Not all funnels behave the same. Two common types are:
Strict (ordered) funnels: Users must complete steps in the given order. This is useful for checkout flows or onboarding sequences.
Flexible funnels: Users can complete steps in different sequences. This is useful when behaviour is non-linear, such as exploring features before signing up.
Also decide between:
- User-based funnels (unique users per step)
- Session-based funnels (unique sessions per step)
User-based funnels help measure longer journeys; session-based funnels can reveal short-term friction.
Finding Drop-off Points and Diagnosing Causes
Identify the Largest and Most Costly Drop-offs
A large percentage drop is not always the top priority. You should consider both:
- Drop-off rate (percentage decline)
- Absolute volume (how many users are lost)
For example, losing 40% of users between “payment page” and “payment success” may be more urgent than losing 60% between “homepage” and “product view,” depending on volumes and revenue impact.
Segment the Funnel to Locate Patterns
Segmentation turns funnel analysis from descriptive to actionable. Common segments include:
- Device: mobile vs desktop
- Traffic source: organic, paid search, social, referral
- Geography: city/region
- New vs returning users
- Product category, plan type, or user persona
If mobile users drop sharply at checkout but desktop users do not, the problem is likely usability, performance, or payment method compatibility.
Pair Funnel Data with Qualitative Signals
Numbers show where users leave, but not always why. Combine funnel results with:
- Session recordings or heatmaps (where users hesitate)
- Customer support tickets (repeated complaints)
- On-site surveys (“What stopped you today?”)
- A/B test results
This combination helps you avoid guessing. It also supports stronger recommendations, which is a key skill emphasised in a data analyst course in Pune setting where analysts are expected to explain insights, not just compute them.
Turning Insights Into Improvements
Once the drop-off step is identified, prioritise fixes using a simple impact-effort approach:
- High impact, low effort: quick wins (copy changes, form simplification, bug fixes)
- High impact, high effort: major projects (checkout redesign, onboarding flow rebuild)
- Low impact: deprioritise unless it supports a larger strategy
After implementing changes, measure results with controlled experiments where possible. Funnel improvements should be tracked over time to ensure gains are stable and not seasonal fluctuations.
Conclusion
Funnel analysis is a structured methodology for identifying where users abandon a conversion pathway and why that happens. The process involves defining measurable stages, validating event tracking, selecting the right funnel type, and analysing drop-offs using segmentation and supporting evidence. When applied well, funnel analysis directly guides product and marketing decisions by showing what to fix first. Whether you are studying through a data analytics course or applying these methods in a business role, mastering funnel analysis will help you move from reporting metrics to driving meaningful conversion improvements.
Contact Us:
Business Name: Elevate Data Analytics
Address: Office no 403, 4th floor, B-block, East Court Phoenix Market City, opposite GIGA SPACE IT PARK, Clover Park, Viman Nagar, Pune, Maharashtra 411014
Phone No.:095131 73277